In the early days of the IPA Wars, the growing craft resistance lacked the necessary firepower to battle deep into the retail galaxy. In 2012, a long-time Jedi who trained under Sierra Nevada emerged having developed the necessary weapon system that could change the fate for the craft breweries experiencing rapid growth. By pooling resources under a common flag, the resistance of independent breweries would go on the offensive, claiming valuable shelf space from the Dark Side.
When I started at Revolution Brewing in 2016, the only external data that we had access to was a quarterly export from the market research company IRI (now called Circana). This scan data would consolidate and summarize the beer sales taking place at the big chain grocery stores in our local geography. Access to the rankings in the market provided snapshots of our own performance compared to our competition, along with pricing, market share, distribution depth, and trends versus past time periods. The data armed leadership with a better understanding of the opportunities and headwinds that lied ahead, while providing our Sales team with compelling talking points heading into a big meeting. While helpful, these excel files were both very expensive, and far too limiting, as far as our ability to drill beneath the surface.
About a year into my tenure at Rev, the opportunity to join a “collective” called Armadillo Insights came along. The company was founded in 2012 by Douglas Mills, who spent well over a decade at Sierra Nevada in Sales, Category Management, and as their Director of National Accounts. The perfect background both on paper, and in reality. Armadillo would sign up a critical mass of large & regional craft breweries in order to partner with IRI to afford all all geographies and time periods. They would feed the files into a data visualization tool called Tableau and provide clients access, updating it regularly, with built-out, filterable dashboards. The result would give members of the collective access to all the data nationally, with easy ways to answer any possible question that could come to mind.
For the sake of an example, albeit a small one, let’s pretend we’re an moderately-sized Chicagoland brewery with solid distribution in our home market. We’re hoping to reach into our small batch recipe book and land on a less competitive category to try to own, on top of the existing flagship we’re known for. Ideally a style with a passionate, but underserved market, rather than attempt to compete any further in the vast world of IPAs than we already do. The brewers at this fictitious brewery are passionate about saisons, so let’s look into the opportunity and see if its viable.
Category Health
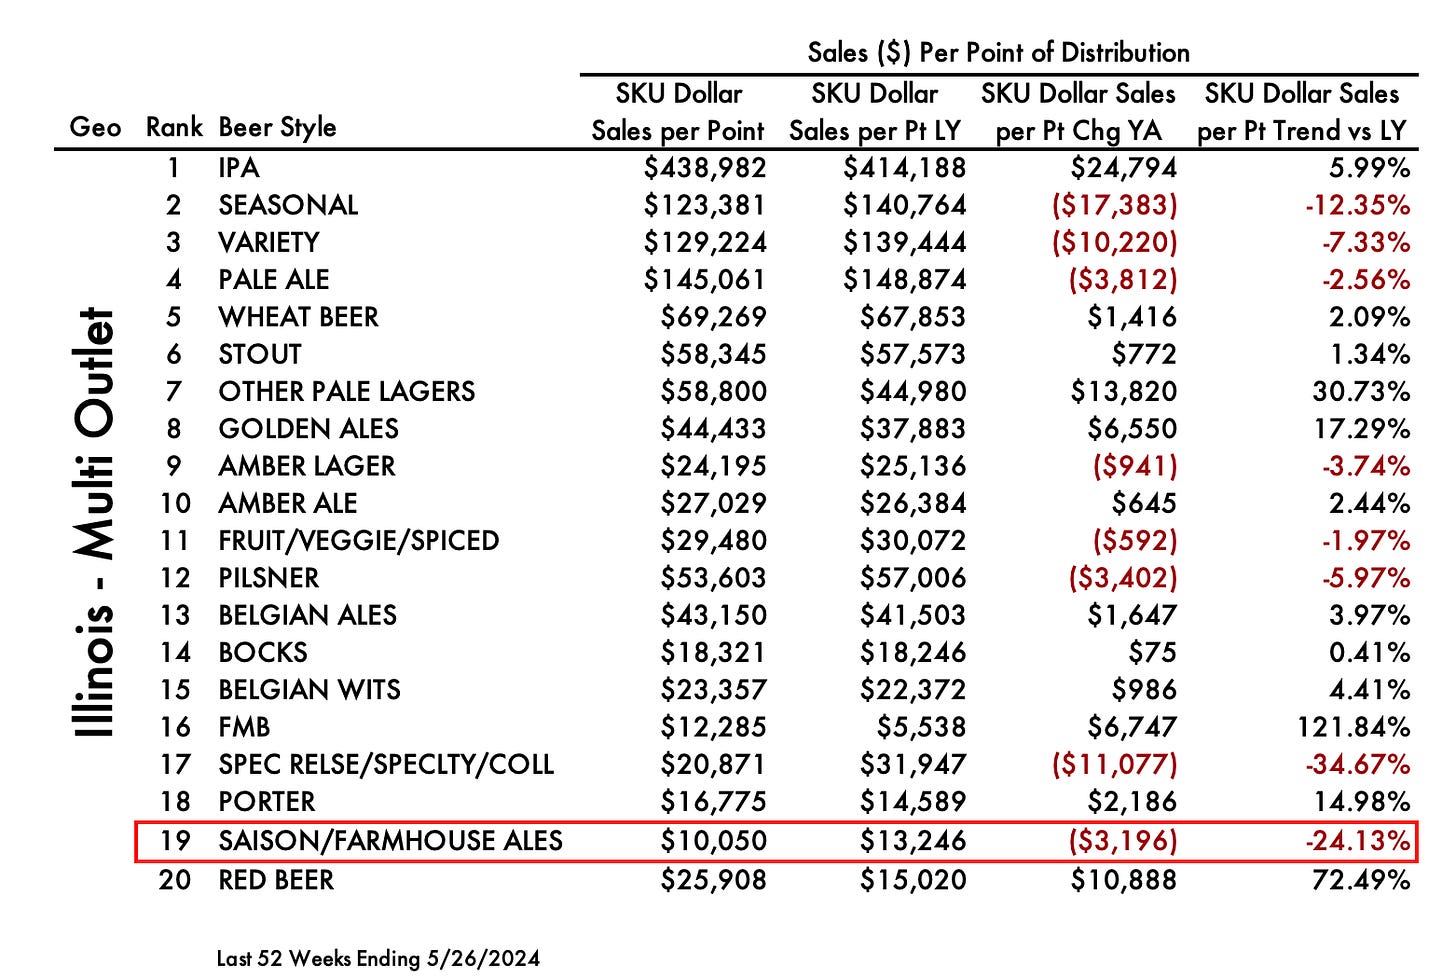
I like to begin by looking at a basic view of the CRAFT styles in my home market. Saison at least made the Top 20, but not by much at #19. While not a huge amount of sales, there’s certainly something there and at least it’s trending in a positive direction +1.79% in dollars over the last 12 months. Given the inflationary price increases that have been taking place, that doesn’t necessarily mean volume is up, but it certainly isn’t bad picture to paint these days.
While the opportunity alarm bells aren’t going off uncontrollably, I continue to dig in and want to put myself in the shoes of the retailer who I’d be pitching my saison to. The next step is to understand how the style is doing Per Point of Distribution. In other words, for each shelf spot being taken up by a saison, how are they performing on average? Unfortunately for saison, this is where things start to get ugly.
How can saisons be up 1.79%, but down (24.13%) per point of distribution? In this case it could mean that distribution expanded and the style, or one particular SKU, received new opportunities on the shelf. That could mean new stores or it could mean an additional format, like cans in addition to bottles or a 12-pack in addition to a 6-pack (very unlikely with saison). While yes, overall slightly more dollars are being generated from saisons, it’s also becoming less efficient and resulting in less dollars on average at each individual store/shelf spot.
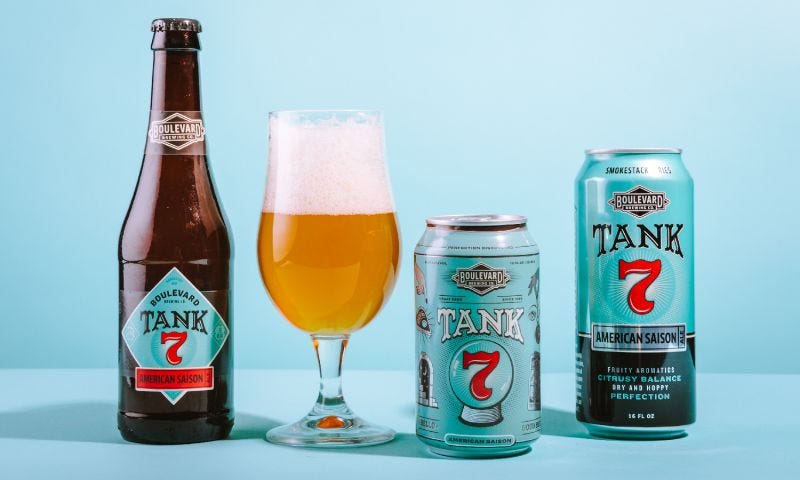
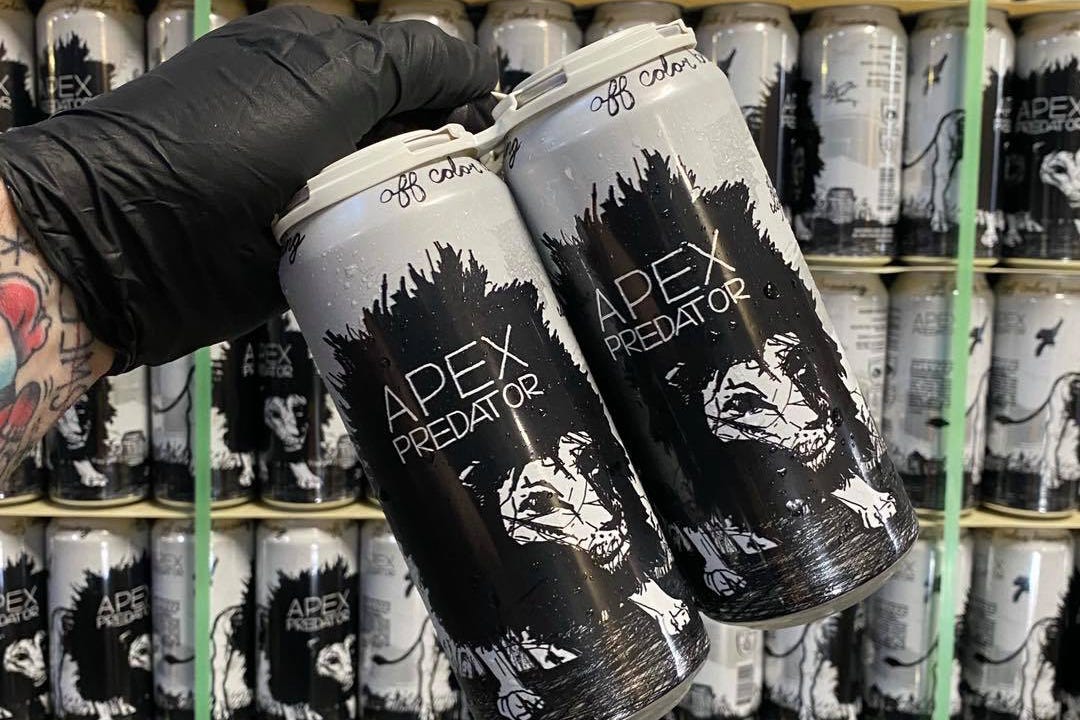
Not only is it important to understand a category’s size relative to the market and the momentum behind it, but you also want to know specifically who else is competing. Using the saison example, Armadillo Insights helps me to easily drill in and see that that it’s a two horse race with an insurmountable lead for Off Color’s beloved Apex Predator with Boulevard’s Tank 7 as the closest thing to a threat. To enter this category you’d want to be convinced that 1) its poised to grow, 2) that you can take meaningful market share away from the category leader, and/or 3) your marketing will bridge fans of another category into your saison brand.
Since this Saison list is short, and thus a little anti-climatic as far as depth, let’s walk through a bigger and broader category, like the local Premium Lagers that have been hitting the market full force. But to begin, let’s take into account that we’re not a big regional or national player and thus, not going to compete with the domestics and economy beers due to price. However, maybe the type of person willing to pay for an import, in addition to “craft” is a little more feasible. Armadillo gives you an easy path to include and exclude whichever data sets you want. So for this example I’m pulling in Craft, Craftesque (Macro-acquired or created Crafty Brands), and Imports in the 4 relevant beer styles that would more broadly be considered Lager.
Now you might be thinking, “Doug, where’s this Cold Time Premium Lager you’ve been talking so much about?” Great question, glad you asked. This chart is the last 52 weeks, but Cold Time didn’t launch until January, and really didn’t penetrate chain retailers until a few months ago. So you always need to ask yourself if you’re comparing apples to applies. Armadillo gives you the ability to quickly toggle to a more recent time frame, such as the last 4 weeks where you’ll see Cold Time pass our own Rev Pils and jump up to #30.
A less talked about benefit of having access to this data in such real time (delayed a few weeks) is the ability to gamify your company’s sales goals for all to see. If employees are properly incentivized and bought-in, these rankings are an opportunity to share your progress internally and rally your team, or entire company.
The Selling Story
Once the beer earns its opportunities on the shelf, and customers begin agreeing with their dollars, the data starts rolling in. As the brand climbs up the list and begins passing competitors, the data can be weaponized and used to rationalize more wins when pitching retail partners. If the numbers prove that your brand is out performing competing brands that a retailer carries, it’s tough to argue that a home on the shelf is not deserved.
Scan data is not meant to tell you what to brew, which is an ever present conflict I love to poke fun at between Sales, Marketing, and Brewing. It can certainly help you figure out which ideas can scale though, as understanding the entirety of the market can provide extremely valuable perspective and reality of where the white space or momentum is forming. The real value though for an established brewery is this selling story that comes through using the data to identify every opportunity that your brand deserves, but hasn’t been given yet.
The Next Jedi
In April 2020, Armadillo was acquired by Fintech, a fascinating company who was covered in Episode 2. When there’s a great product like Armadillo solving a such a relatable problem, competition is naturally is going to heat up and when M&A takes place, things accelerate. Most breweries distributing their beer need some form of analysis and as they grow, those resources eventually need to be dedicated, not wearing twenty other hats around the brewery. At the same time, there may not be 40 hours/week of work or the budget to commit to that salary, plus the combination of talent and experience is tough to find. Where Armadillo Insights goes for more of a self-service model, one of their newer competitors goes service-heavy. Stay tuned for the next episode…
Yesterday Beer Crunchers introduced a paid subscription tier to help support the work that goes into these posts and to invest behind collaborations in the future. If you find pieces like Beer Data Wars helpful for efficiently educating yourself or team on ways that data can be used, please consider upgrading to premium.
Thank you in advance for the support.
-Doug
Beer Data Wars - Episode 2
Prior to the craft resistance, there existed a simpler Republic. The majority of beer and it’s underlying transaction data rolled up through two rival empires: Blue (MillerCoors) & Red (Bud) wholesalers. While the two were constantly at odds on the streets through pricing, marketing spend, and television commercials, enough space existed for both to gro…
Beer Data Wars - Episode 1
A long time ago, during a time in the craft beer industry that seems far far away, breweries couldn’t keep up with demand. The Sith macro brands were being challenged by rebel start-ups assembling a selling story that included smaller batches, bigger flavor, freshness, and locally made, taking aim at 20% market share by 2020. Camaraderie within this res…


