


Beer Data Wars - Episode 5: Untappd Potential
Beer Data Wars - Episode 5: Untappd Potential

As hop enthusiasm spread throughout the galaxy, rebels began seeking out technology to log their achievements and pursuit of Jedi status. Since the early days of the IPA Wars, one single tool has reigned supreme. While some factions within the craft resistance fear its power, the potential is undeniable. Now, as the resistance faces their biggest set of challenges yet, the data left behind by these rebel tickers could provide the blueprint to surviving their never ending war against the dark, macro side.
An Endless Universe of Data
In the world of beer analytics, scan data from NIQ and Circana receive the bulk of the attention for their power and actionability, however these powerful sources rarely meet the specs of the craft brewers comprising the industry’s long tail. The these small and local businesses focus more on independent retailers + their own-premise, lack distribution depth, and target more niche categories. While some industry members criticize Untappd for its skewed ratings of intense beer styles, the platform still holds a treasure trove of data that could be invaluable to breweries willing to explore creative use cases.
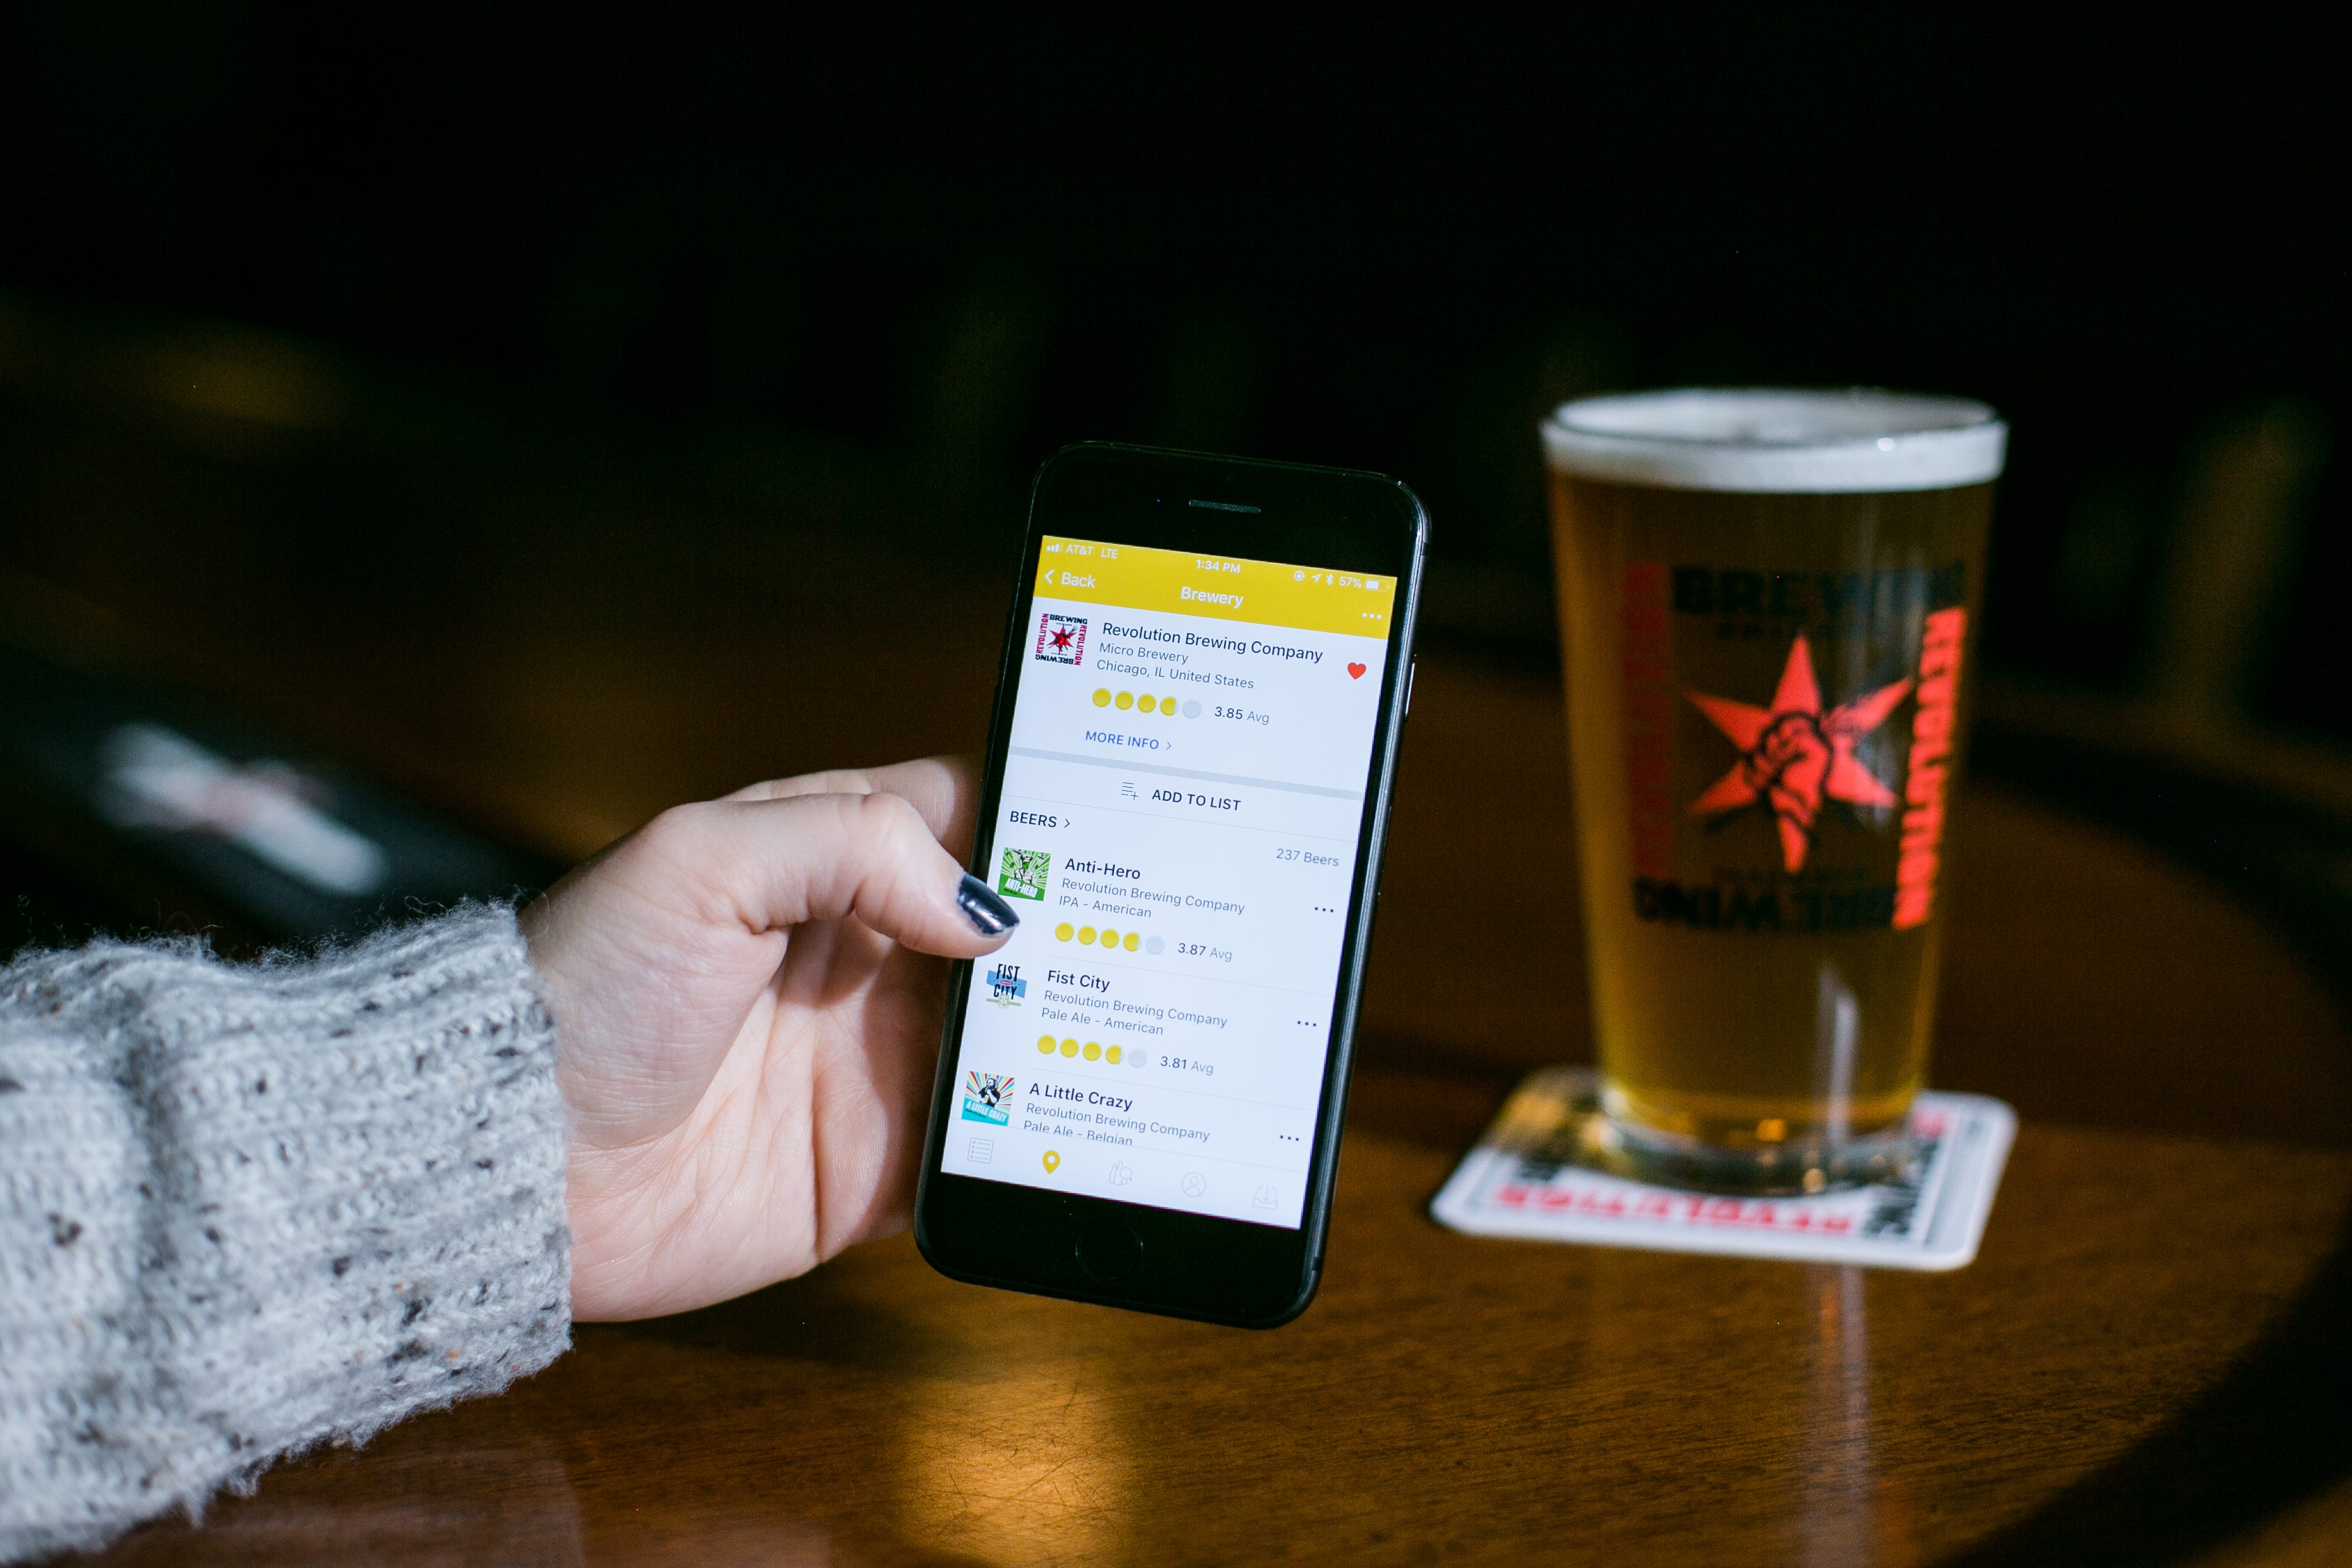
Founded by Greg Avola and Tim Mather in 2010, Untappd emerged in the wake of apps like FourSquare, which allowed users to check in and share their locations on platforms such as Facebook, Instagram, and Twitter. Unlike these general social media sites, Untappd—now owned by Next Glass—focuses exclusively on beer enthusiasts. Among other things, it lets users log details about each beer they try, including its format, location, rating, descriptors, and comments. Each check-in is convenient linked to an extensive string of data about that specific beer (style, ABV, etc.), brewery (location, size, etc.), and the place of purchase.
Untappd Insights, a relatively new web-based tool from Next Glass, provides access to dashboards that aggregate historical beer check-in data. These pre-built reports can be filtered to help breweries pinpoint their market segments, specific styles, accounts, trends, and more. While these dashboards are useful, Untappd emphasizes that the real value of their data lies in the custom requests that go beyond the capabilities of standardized dashboards.
Since Spring, I’ve had the opportunity to explore Untappd Insights and engage with their tools. Here are some are just a few exciting theoretical use cases I’ve come across:
The Seasonality and Health of Beer Enthusiasm
Having nothing to do with the ROI behind Untappd Insights, right out of the gate I found it eye-opening to look at total check-ins by month, over time. The declining numbers are certainly alarming and speak to the normalization taking place in craft beer, including less rotation and greater focus on flagships. I am even more fascinated though by the ability to quantify the drop-off in engagement from December to January each year. Recovering from the holidays, combined with New Years resolutions and Dry January, led to a 21% month-over-month decline in January 2023 check-ins, which ballooned to a 30% month-over-month drop in January 2024.
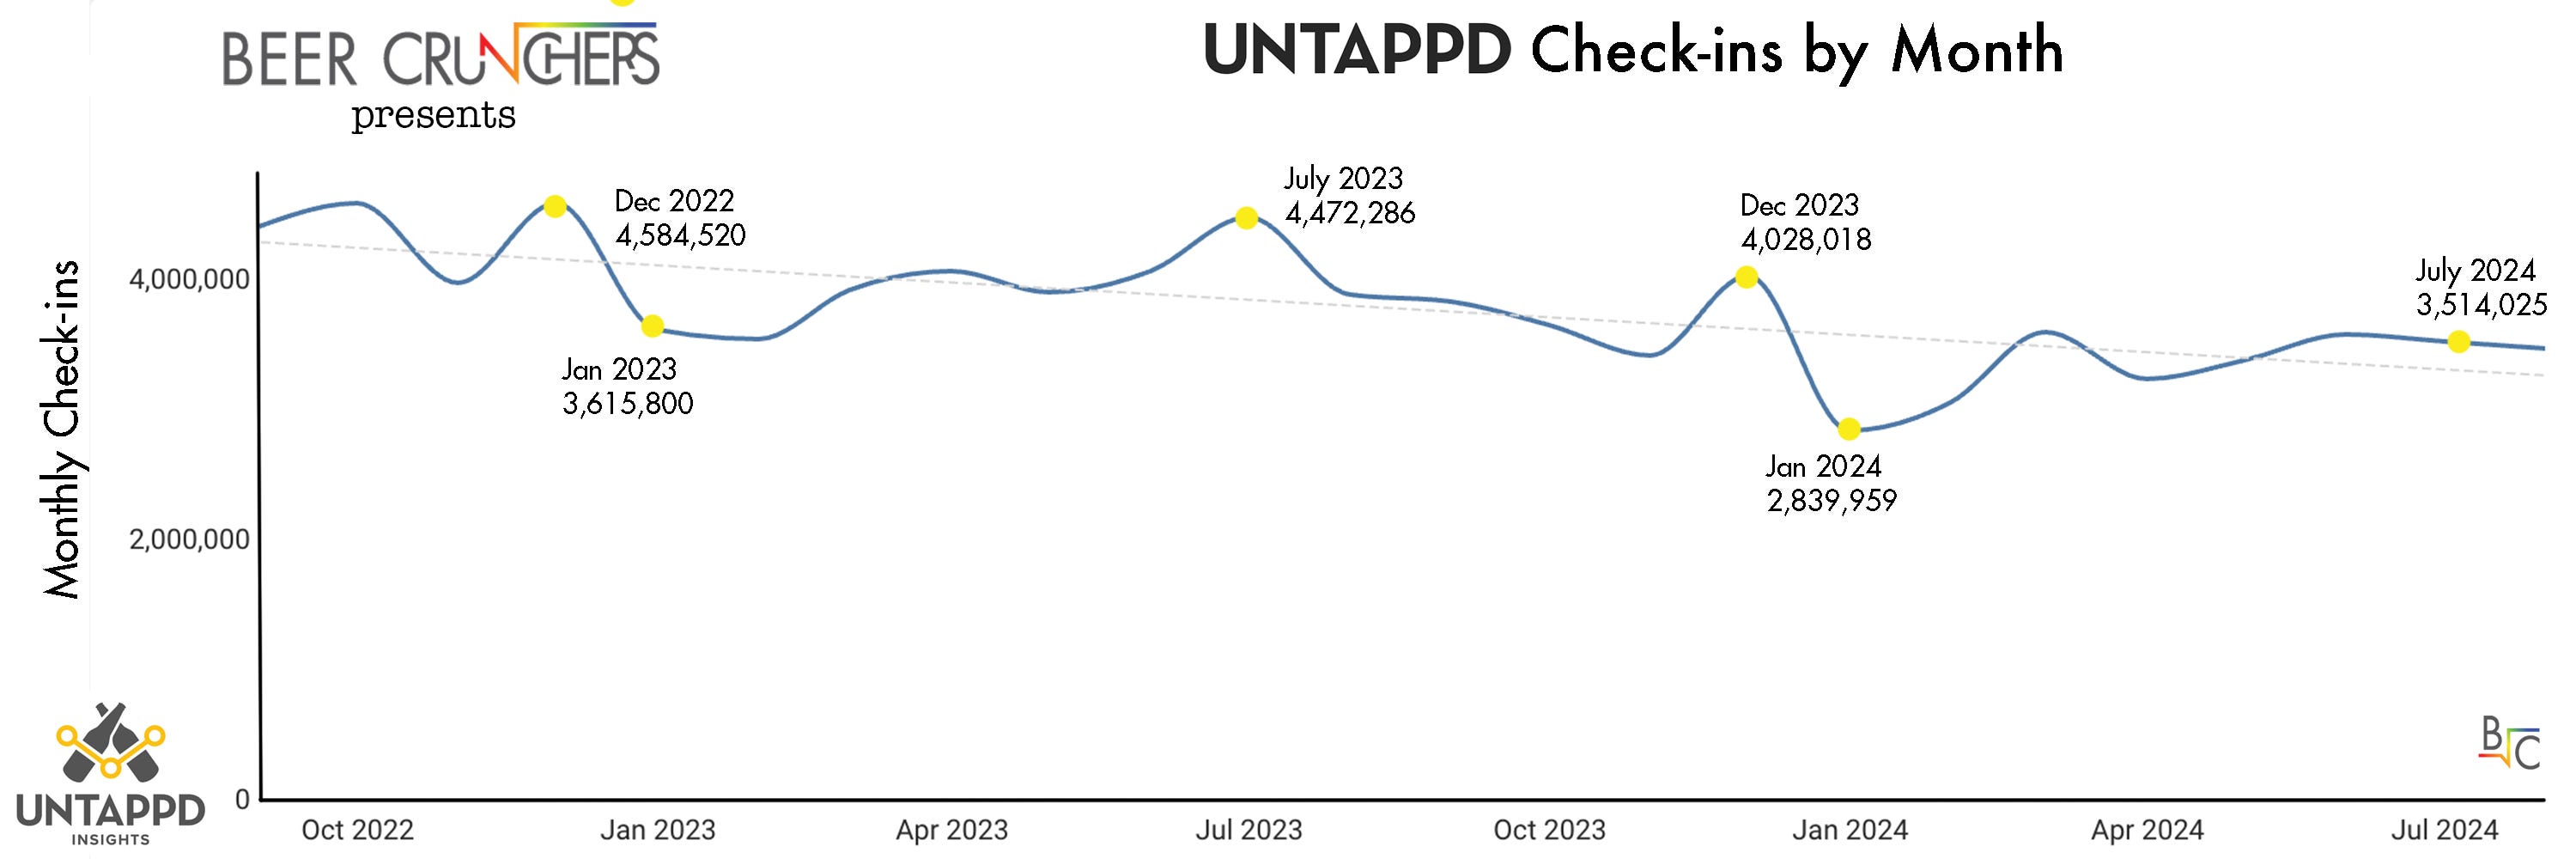
This chart shows strong rationale for why so many breweries are exploring NA beer, sparkling hop waters, THC, and other non-alcoholic opportunities. With each Dry January that passes, we’re seeing a significant decline in craft beer engagement the following year. Using filters, an Untappd Insights user could narrow this chart down to their specific brewery or city to see how, for example, a city like San Diego, with its consistent weather, compares to my hometown of Chicago that experiences the seasons.
Quality Anomalies
Talk to anyone from Untappd about their Insights tool and they’ll bring up the following use case for their data. Imagine if you could pull the average ratings for a given beer, specifically on draft, by location/bar. What if there is one, or a handful of locations, that are scoring significantly worse than all the other bars and restaurants? Wouldn’t you want to look into why? This could be the result of a few different scenarios, such as:
The bar is pouring the wrong beer by mistake and calling it your beer. One time I ordered our pale ale Fist City at a restaurant and was served a Lagunitas Aunt Sally sour. I knew it couldn’t possibly be our beer, but would a passive customer be confident enough to send it back? Instead, that could be the last Fist City they ever purchase.
The bar has poor draft line quality and its doing a disservice to your beer.
The bar’s clientele is simply not a good fit for your beer.
This theoretical report could serve as a semi-automated tool for monitoring and mitigating reputation damage, although it might be cost-prohibitive for smaller breweries. If Untappd were able to scale and standardize this service, making it easily affordable, it could offer a monthly “Top 10 Account Anomalies Report.” Such a report could be automatically sent to brewers, providing a curated list of accounts that warrant attention.
Rebrands and Reformulations
Two of craft beer’s earliest trailblazing brands, Boston Lager and Fat Tire, reformulated their recipes from ambers to goldens in early 2023. Fat Tire’s updates came along with a significant overhaul of the packaging as well, positioning it as more GenZ friendly and in line with the company’s commitment to sustainability. Given the stakes and scale of these two companies, not to mention the budgets they have to work with, both are prime contenders to work with Untappd.


Despite the new recipe and packaging, both the “new” Fat Tire and “old” Fat Tire share the same historical entry on the app, making it challenging to compare the two. As a result, one way that New Belgium might want to use Untappd Insights would be to evaluate the consumer response to these changes over particular time periods, how it varies by region, specific words being used to describe new Fat Tire versus old Fat Tire, etc. Here’s a little data I pulled from the dashboards looking at the prior three years:
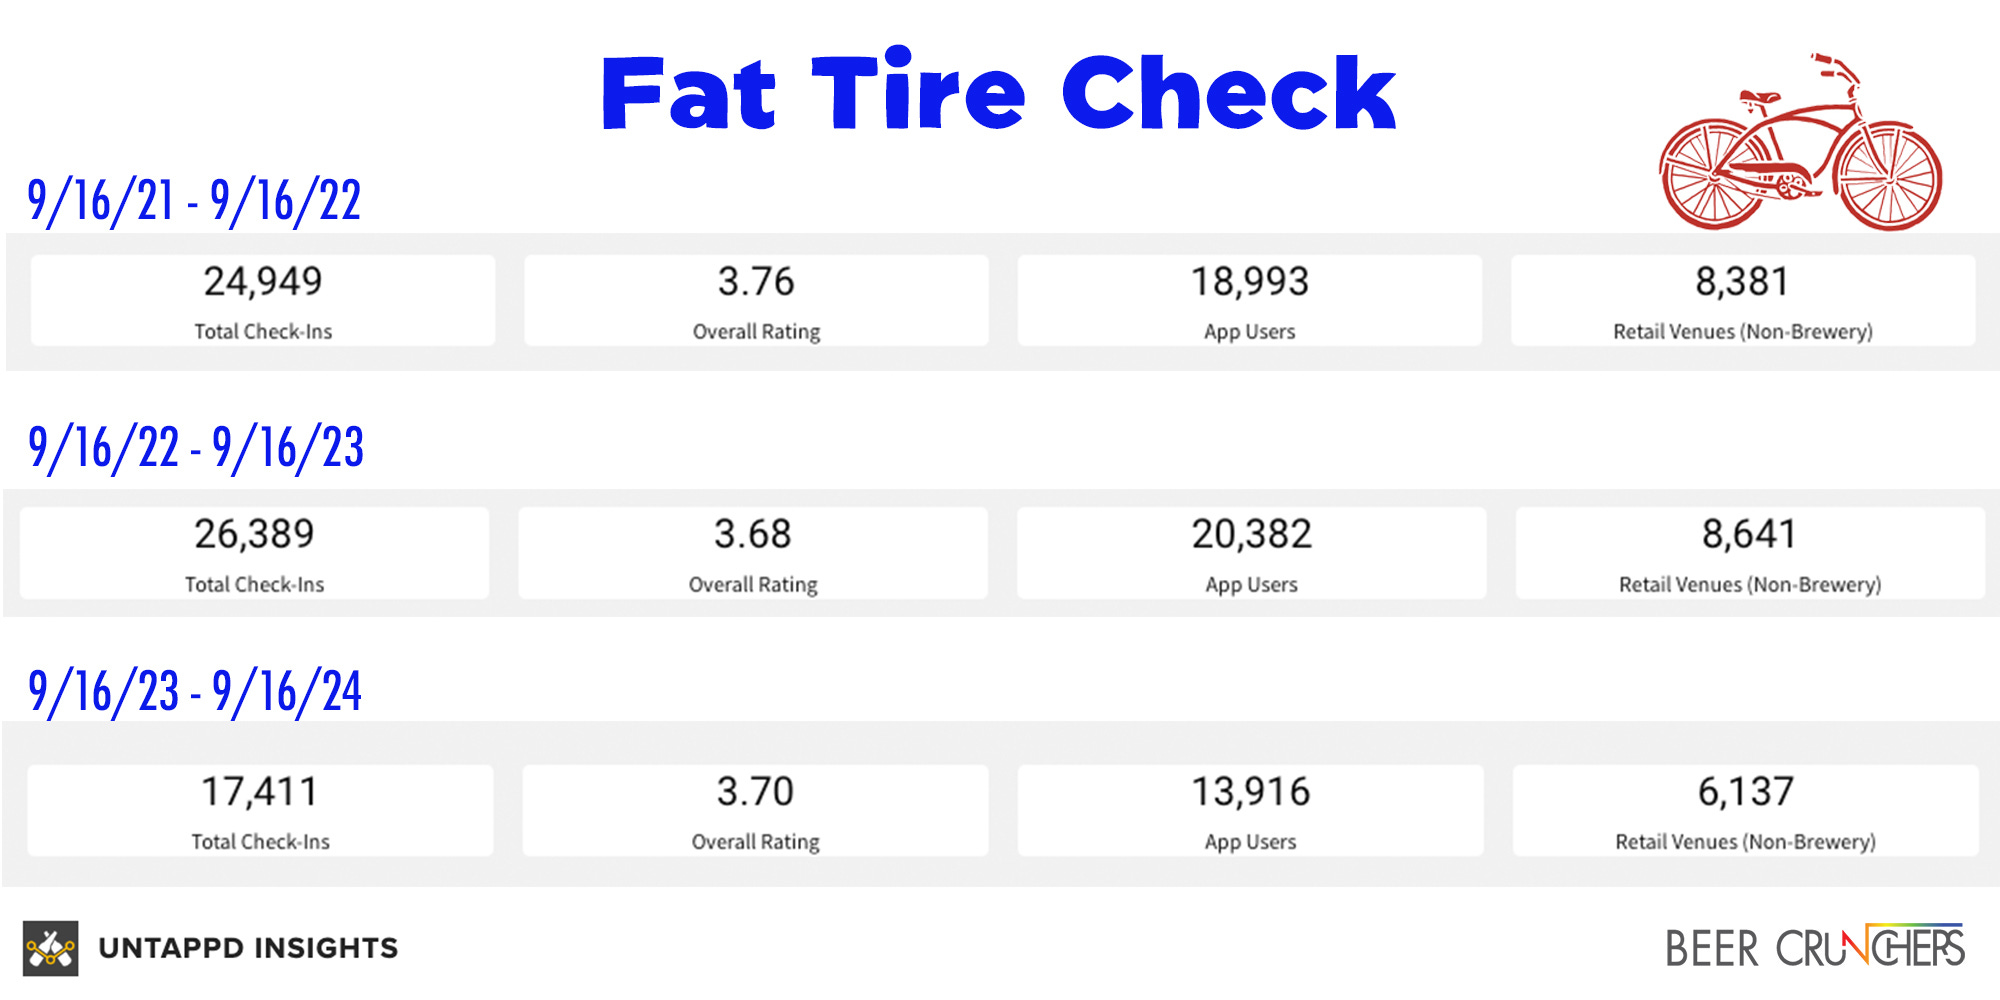
There’s a lot happening here, but according to the data, the refresh led to an increase in check-ins over the course of the first year, followed by a drastic -34% drop in the next 12 months. Now, you might think that Untappd is not a good measurement tool for Fat Tire’s trajectory, but I checked NIQ and the brand is similarly down -28% over roughly the same 52 week period, trending worse at -31% Year-to-Date (in $). Don’t shed too many tears for New Belgium though, as the company continues their torrid pace overall, up 13% in both the Last 52 weeks and YTD thanks to a certain witty skeleton.
Buying Decisions
When considering opportunities to utilize Untappd data strategically, most immediately think of breweries as the logical customer. I would actually argue though that chain retailers, in both the off and on-premise, have the strongest and most scalable use case. While craft beer has certainly lost a lot of it’s hype and FOMO in the broader context of beverage alcohol, local still remains king and as a result, many beer category managers are given autonomy to make buying decisions at the local store level. If that’s my job, I’d love to be able to answer the following questions that my internal data and scan data can’t answer.
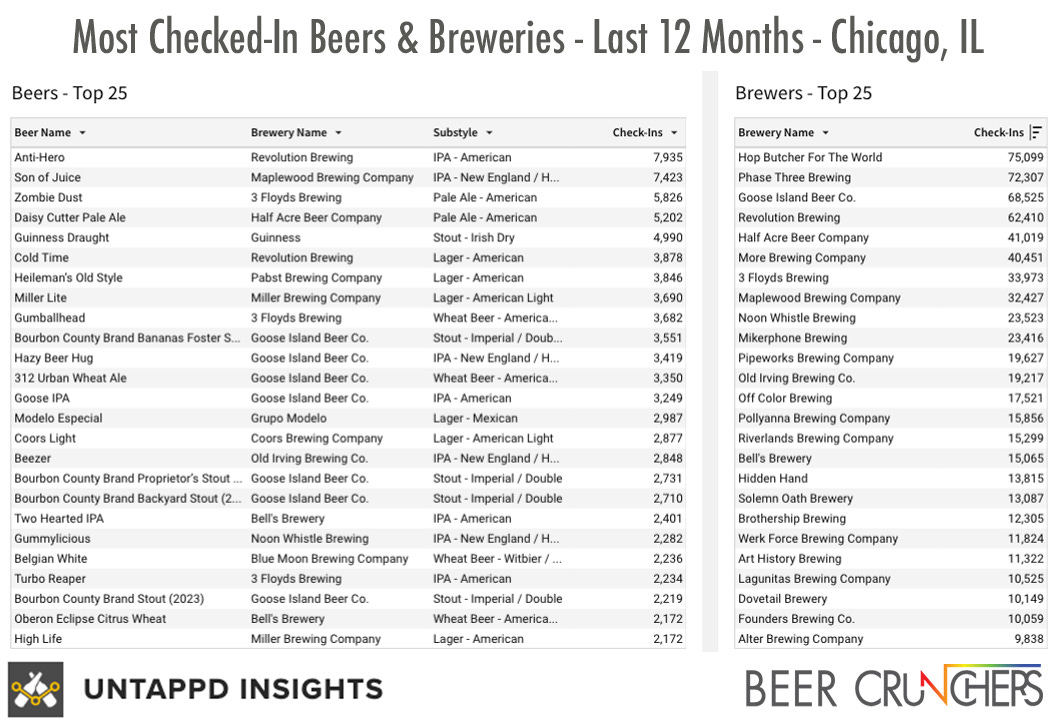
🏆 Feature the Right Brands: What local breweries have the most check-ins in the last 3 months, 12 months, etc. that took place in the tight geography where my store shoppers / bar patrons reside?
📈 Momentum Check: What breweries and styles are seeing an increased number of check-ins, compared to the same period last year, sorted by volume? In other words, who and what is picking up steam and should be on my radar, that perhaps isn’t currently?
📊 Audience Size: How many check-ins do these hot, trending breweries have compared to breweries I currently feature? Despite their increasing popularity, are they still relatively small and unknown from a volume of check-ins standpoint? Or are there brands that I don’t carry who appear significantly more popular in my surrounding neighborhoods than brands that I do carry?
🕵️♀️ Peeping the Competition: What are the most checked-in breweries and beers at competing retailers near my location(s)? How do their Untappd scores compare to the same statistics at my location?
For a larger chain restaurant or grocery store, these reports and others could be built and generated periodically for each local buyer across the country, specific to their area. Additionally, they could be built as online dashboards that could be queried and filtered on demand. I don’t mean to imply that these stats would be the only deciding factor, as Untappd users have their own biases, however the data can provide coverage over local blindspots.
Sales Lead Generation
Untappd Insights includes out-of-the-box dashboards that are fun to play around with, generating the chart above, but those are a feature and not the true honey hole in their possession. The real value is in the one-off requests, customized to your objectives, containing information that’s truly actionable. Few breweries outside the Top 50 have a Sales Analyst on staff who have the time to dig through data all day, looking for sales leads, but Untappd has the information to discover them in creative, outside-the-box ways.
For the sake of an example that I cooked up, let’s say there is a competing brewery to you in your market who has a comparable reputation and champions similar styles. Let’s say Hazy IPA and Fruited Sours. What if Untappd could run you a report of retailers where this like-minded competitors’ beer was checked in and purchased in the last year, but no check-ins from your brewery took place.


I wouldn’t suggest this strategy from the standpoint of targeting their handles, but more under the guise of identifying on-premise accounts who are open to Hazy IPAs and Sours in their rotation. I would be especially intrigued by this strategy when it comes to draft beer and digging beyond the obvious, craft centric locations, in an effort to add a little efficiency to that challenging and often inefficient selling process.
Greatest Blog Post You’ve Ever Read, 3.25 / 5.0 🍻
The challenge for both Untappd and breweries looking to tap (sorry) into their consumer data is always going to be the cost, with each request requiring a software developer’s time and effort. Those positions are pricey and Next Glass likely has an endless roadmap of work for them to continuously improve and update their suite of products like Ollie, Oznr, and Untappd. Special projects will often start in the thousands, not hundreds of dollars, but if thought through strategically in a way that’s repeatable and easily adaptable, custom reports and dashboards have the ability to pay long term dividends and unlock the SELL MORE BEER badge for the industry’s long tail 🦕.
Thanks as always for reading. Please consider a premium subscription to get me closer to minimum wage for the work it takes to write these posts 🤪


Is it possible to equivalize total check-ins, by "active user"? It'd be interesting the see total check-ins(or really any of their metrics), but only amongst the more regular users. Similar to how you would look at same store sales to avoid the bump (new stores/users) or the dip (closing stores/users)